AANN 09/01/2024
Fine-tuning for MNIST classification
In this example we are going to fine-tune the model from this post. Well, not really, because we will still use the same MNIST dataset, but it will demonstrate the process. This gets an accuracy on the test dataset of \(99\%\). The original training of this model took about 36 seconds, fine-tuning the model with the same amount of training data took about \(15\) seconds.
Loading packages
import time
import torch
import torch.nn as nn
import torch.optim as optim
import numpy as np
import pandas as pd
import plotnine as p9
from plotnine import *

import niceneuron.io as nn_io
import niceneuron.data as nn_data
Define input and output filenames
Define the files that are used as input and output to keep the program DRY.
images_path = 'data/train-images.idx3-ubyte'
labels_path = 'data/train-labels.idx1-ubyte'
test_images_path = 'data/t10k-images.idx3-ubyte'
test_labels_path = 'data/t10k-labels.idx1-ubyte'

loss_csv = "example-2024-01-09-loss.csv"
loss_png = "example-2024-01-09-loss.png"
trained_model_file = "example-2024-01-04-model.pt"
Loading testing and training data
images = nn_io.read_idx(images_path)
images = images.astype(np.float32)
labels = nn_io.read_idx(labels_path)

train_dataset = nn_data.MNISTDataset(
    images, labels, flatten=False, normalise=True)
train_dataloader = torch.utils.data.DataLoader(train_dataset, batch_size=64, shuffle=True)

test_images = nn_io.read_idx(test_images_path)
test_images = test_images.astype(np.float32)
test_labels = nn_io.read_idx(test_labels_path)
test_dataset = nn_data.MNISTDataset(
    test_images, test_labels, flatten=False, normalise=True)
test_dataloader = torch.utils.data.DataLoader(test_dataset, batch_size=64, shuffle=False)
Defining the model
Recall that in the previous post we trained the following CNN and saved the resulting model state.
class DemoCNN(nn.Module):
    def __init__(self):
        super(DemoCNN, self).__init__()
        self._conv1 = nn.Conv2d(1, 6, kernel_size=5, padding=2)
        self._pool1 = nn.AvgPool2d(2)
        self._conv2 = nn.Conv2d(6, 16, kernel_size=5, padding=0)
        self._pool2 = nn.AvgPool2d(2)
        self._fc1 = nn.Linear(5*5*16, 84)
        self._fc2 = nn.Linear(84, 10)
        self._relu = nn.ReLU()

    def forward(self, x):
        x = self._pool1(self._relu(self._conv1(x)))
        x = self._pool2(self._relu(self._conv2(x)))
        x = x.view(-1, 5*5*16)
        x = self._relu(self._fc1(x))
        x = self._fc2(x)
        return x
We are now going to load that model state and use it to populate the
state of feature extractor module. The feature extractor module can
then be used as a layer in a new network. Since we will usually want
this to be a fixed layer, we add an argument freeze with a default
value of true and then disable gradient calculation. This way, during
subsequent training these parameters stay fixed.
class DemoFeatureExtractor(nn.Module):
    def __init__(self, pretrained_DemoCNN, freeze=True):
        super(DemoFeatureExtractor, self).__init__()
        self._conv1 = pretrained_DemoCNN._conv1
        self._pool1 = pretrained_DemoCNN._pool1
        self._conv2 = pretrained_DemoCNN._conv2
        self._pool2 = pretrained_DemoCNN._pool2
        self._relu = nn.ReLU()

        self.freeze = freeze
        if self.freeze:
            for param in self._conv1.parameters():
                param.requires_grad = False
            for param in self._pool1.parameters():
                param.requires_grad = False
            for param in self._conv2.parameters():
                param.requires_grad = False
            for param in self._pool2.parameters():
                param.requires_grad = False
            # for param in self.features.parameters():
            #     param.requires_grad = False

    def forward(self, x):
        x = self._pool1(self._relu(self._conv1(x)))
        x = self._pool2(self._relu(self._conv2(x)))
        x = x.view(-1, 5*5*16)
        return x
We use a DemoFeatureExtractor as a layer in a new classifier model.
class DemoFineTuner(nn.Module):
    def __init__(self, feature_extractor):
        super(DemoFineTuner, self).__init__()
        self._feature_extractor = feature_extractor
        self._fc1 = nn.Linear(5*5*16, 84)
        self._fc2 = nn.Linear(84, 10)
        self._relu = nn.ReLU()

    def forward(self, x):
        x = self._feature_extractor(x)
        x = self._relu(self._fc1(x))
        x = self._fc2(x)
        return x
To create a DemoFeatureExtractor we first need a DemoCNN.
pretrained_cnn = DemoCNN()
pretrained_cnn.load_state_dict(torch.load(trained_model_file))
feature_extractor = DemoFeatureExtractor(pretrained_cnn)

model = DemoFineTuner(feature_extractor)
Fine-tuning the model
Then we need to define a training loop to do the fine-tuning.
loss_fn = nn.CrossEntropyLoss()
optimizer = optim.Adam(model.parameters(), lr=1e-3)

model.train()
loss_history = []
training_start_time = time.time()
for epoch in range(5):
    epoch_cumloss = 0
    for images, label in train_dataloader:
        images = images.unsqueeze(1)
        # Forward pass
        logits = model(images)
        loss = loss_fn(logits, label)
        epoch_cumloss += loss.item()

        # Backward pass
        optimizer.zero_grad()
        loss.backward()
        optimizer.step()

    print(f"Epoch {epoch} loss: {epoch_cumloss}")
    loss_history.append((epoch,epoch_cumloss))

training_finish_time = time.time()
print(f"Training took: {training_finish_time - training_start_time}")

loss_df = pd.DataFrame(loss_history, columns=['epoch', 'loss'])
loss_df.to_csv(loss_csv, index=False)
Test the model
Then we test it with the following loop. Note that we have turned the gradient tracking off as this runs slightly quicker.
model.eval()
correct = 0
total = 0
with torch.no_grad():
    for images, label in test_dataloader:
        images = images.unsqueeze(1)
        logits = model(images)
        predicted = torch.argmax(logits, dim=1)
        total += label.size(0)
        correct += (predicted == label).sum().item()

# print test accuracy
print(f"Test accuracy: {correct / total}")
Visualise the results
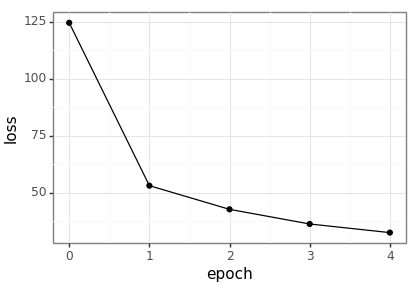
Plot the resulting loss values across the epochs.

loss_df = pd.read_csv(loss_csv)
loss_p9 = (
    ggplot(loss_df, aes(x='epoch', y='loss')) +
    geom_point() +
    geom_line() +
    theme_bw()
)
loss_p9.save(loss_png, height = 2.9, width = 4.1)