aez-notes
Lengths of Random Chords
If a chord is selected at random on a fixed circle, what is the probability that its length exceeds the radius of the circle?
This is a classic example used to demonstrate the importance of making your probability distribution explicit. Three solutions are presented below as diagrams to illustrate particular distributions.
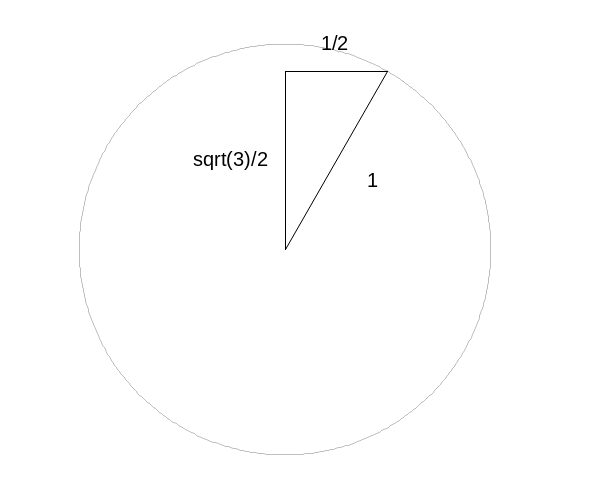
Uniform distribution on a horizontal chord
The solution in this case is \(\sqrt{3}/2\).

load(draw)$

h : sqrt(3) / 2;

draw2d(
  /* Draw the unit circle */
  <<draw-circle>>
  /* Draw the triangle */
  color = "black",
  triangle([0,0], [0,h], [1/2,h]),
  /* Annotate the diagram */
  font = "Arial",
  font_size = 15,
  label(
    ["1/2", 1/4, 1],
    ["1", h/2, 1/3],
    ["sqrt(3)/2", -1/4, h/2]),
  /* Set up the output */
  <<setup-output>>
  file_name = "problem-25-a",
  terminal = 'png
  )$
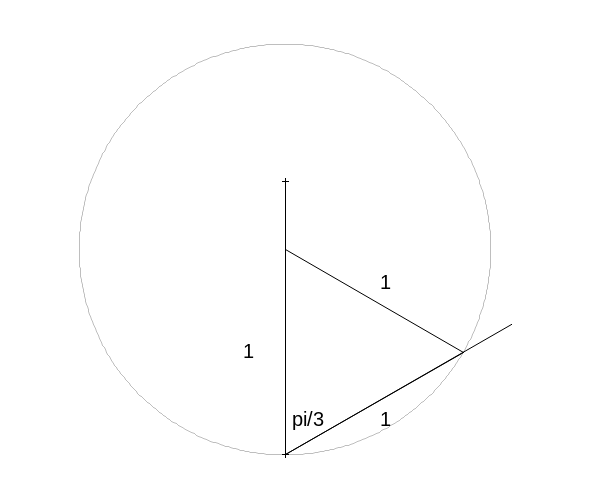
Uniform distribution over the angle
The solution in this case is \(2/3\).

draw2d(
  /* Draw the unit circle */
  <<draw-circle>>
  /* Draw the lines */
  color = "black",
  points_joined = true,
  points([0,(8/6) * cos(%pi/6)],[-1,(8/6)*sin(%pi/6)-1]),
  points([0,0],[-1,2/6]),
  /* Draw the triangle */
  triangle([0,0], [0,-1], [cos(%pi/6), sin(%pi/6)-1]),
  /* Annotate the diagram */
  font = "Arial",
  font_size = 15,
  label(
    ["1", -1/6, -1/2],
    ["1", 1/2, -1/6],
    ["1", 1/2, -5/6],
    ["pi/3", 1/8, -5/6]),
  /* Set up the output */
  <<setup-output>>
  file_name = "problem-25-b",
  terminal = 'png
  )$
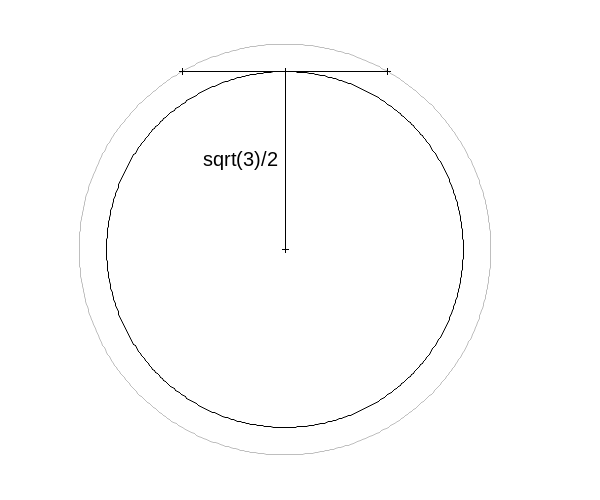
Uniform distribution on center point
The solution in this case is \(3/4\).

draw2d(
  /* Draw the unit circle */
  <<draw-circle>>
  /* Draw the lines */
  color = "black",
  points_joined = true,
  points([0,0],[0,h]),
  points([-1/2,1/2],[h,h]),
  /* Draw the inner circle */
  line_type = dashes,
  ellipse(0,0,h,h,0,360),
  /* Annotate the diagram */
  font = "Arial",
  font_size = 15,
  label(
    ["sqrt(3)/2", -1/5, h/2]),
  /* Set up the output */
  <<setup-output>>
  file_name = "problem-25-c",
  terminal = 'png
  )$
Helpers
Drawing the circle
draw-circle
nticks = 500,
color = "grey",
line_type = solid,
transparent = true,
ellipse(0,0,1,1,0,360),
Set up output
setup-output
xrange      = [-1.1,1.1],
yrange      = [-1.1,1.1],
axis_bottom = false,
axis_left = false,
axis_top = false,
axis_right = false,
xtics = false,
ytics = false,
proportional_axes = 'xy,